Standard deviation is a statistical measure that tells us how spread out the values in a dataset are around the mean (average). It is a crucial element of statistical analysis, offering insights into variability and helping to make sense of the data at hand. In this article, we will examine what standard deviation is, how it works, its formula and why it is important.
Standard deviation in mutual funds measures how much the returns of a fund have deviated from the benchmark or average returns. It helps you determine the level of risk associated with a mutual fund, allowing you to compare different options to make informed investment decisions.
A high standard deviation suggests the fund’s returns are highly volatile and its performance can vary significantly from its average return. On the other hand, a low standard deviation indicates the fund's returns are more consistent and closer to the average returns.
You can use this metric to identify funds that align with your risk profile. If you're seeking potentially high returns and have a high risk tolerance, you can invest in funds with a high standard deviation. Alternatively, if you have a low risk appetite and wish to invest in funds with stable returns, you can consider investing in funds with a low standard deviation.
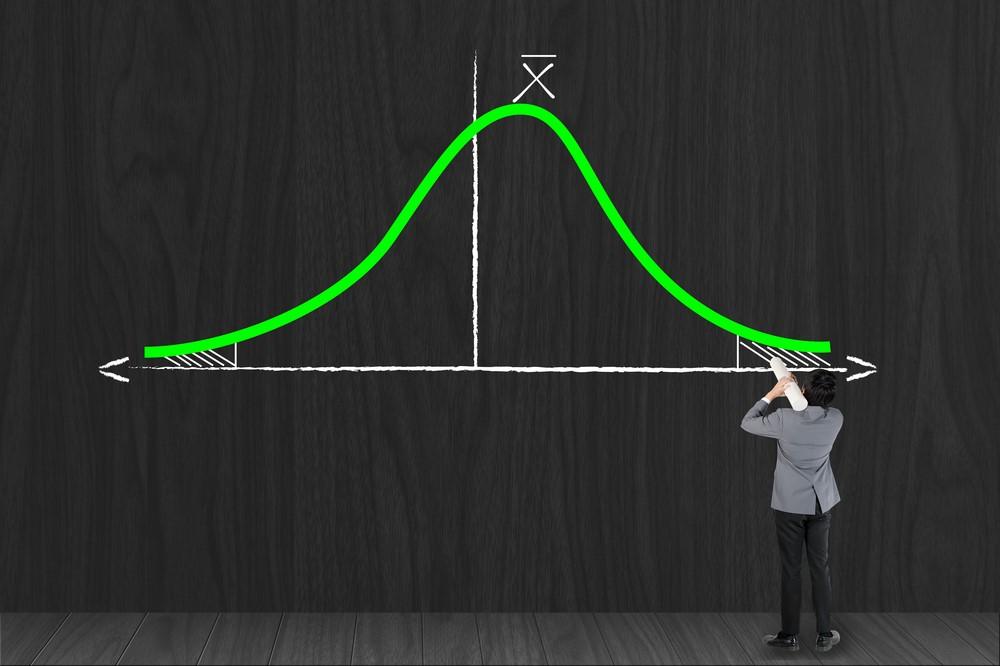
Standard deviation measures the degree to which individual data points in a dataset vary or 'deviate' from the mean, or average, of the data set. In other words, it gives a sense of how spread out the values in a dataset are.
If the data points are generally close to the mean, the standard deviation is small. If data points are widely spread out from the mean, the standard deviation is large. For instance, if we have two data sets with the same mean, let us say 100, the one with values more concentrated around 100 will have a smaller standard deviation than the one with values scattered more widely.
The process of calculating the standard deviation involves a few steps. The formula for calculating the standard deviation depends on whether you have data for an entire population or a sample.
For a population:
σ = sqrt[ Σ ( Xi - μ )^2 / N ]
Where:
- σ is the population standard deviation,
- Xi represents each value from the population,
- μ is the population mean,
= N is the total number of values in the population.
For a sample:
s = sqrt[ Σ ( xi - x̄ )^2 / (n - 1) ]
Where:
- s is the sample standard deviation,
- xi represents each value from the sample,
- x̄ is the sample mean,
- n is the total number of values in the sample.
Understanding standard deviation involves recognising its role in illustrating the dispersion within a dataset. Let us consider an example.
Suppose you have two classes of students and their respective scores on a test.
Class A: 85, 90, 95, 100, 105; Class B: 70, 80, 95, 110, 120
Both classes have an average (mean) score of 95, but when we calculate the standard deviation for each class, we get about 7.9 for Class A and 20.6 for Class B.
This tells us that even though the average score is the same for both classes, the scores in Class B are more spread out from the mean compared to Class A.
Comparing standard deviations is a way to understand variability across different datasets or within subsets of a dataset.
If you are comparing two datasets with different means, you might find that one has a higher standard deviation than the other. This does not necessarily mean that one dataset is more variable than the other, as the standard deviation is influenced by the mean. A dataset with a larger mean might have a larger standard deviation simply because the values themselves are larger, not because they are more spread out.
When comparing standard deviations, it is crucial to consider the context. Comparing the standard deviations of datasets with similar means can give a good sense of which dataset is more variable. Similarly, comparing the standard deviations of subsets within a dataset can reveal whether some subsets are more variable than others.
Standard deviation is important in several ways.
First, it is a fundamental measure of variability. Whether you are a researcher analysing data from an experiment, a businessperson looking at sales trends or a policymaker examining population data, knowing the standard deviation can help you understand the range of possible outcomes and how much they are likely to deviate from the average.
Moreover, the standard deviation is a crucial component of many statistical tests and procedures. It is used in calculating confidence intervals, conducting hypothesis tests and creating statistical models.
Finance – Portfolio Management and Investment
In finance, particularly in portfolio management and investment, the standard deviation measures the volatility or market risk associated with an investment. Higher standard deviation values indicate higher volatility and therefore higher risk, while lower values suggest lower risk.
For instance, let us consider two investment funds, Fund A and Fund B, with the same average annual return of 8%. However, Fund A has a standard deviation of 4%, while Fund B's standard deviation is 10%. This suggests that returns for Fund A are more predictable and less volatile than Fund B. Therefore, conservative investors, who prioritise steady returns over high gains, might prefer Fund A due to its lower risk.
Banking – Credit Scoring
In banking, the standard deviation is used in the credit scoring process, which predicts the probability of a borrower defaulting on a loan. Financial institutions gather various data points, such as the borrower's income, existing debts and credit history.
Consider that a bank has data on borrowers' incomes with a mean of Rs. 50,000 and a standard deviation of Rs. 10,000. If a particular borrower's income is Rs. 70,000, we know that their income is two standard deviations above the mean. This information, along with similar computations on other data points, feeds into a model that generates a credit score.
In this case, the standard deviation helps the bank understand how typical or atypical each piece of data is. Borrowers with data that is closer to the mean on all data points might be seen as less risky, given that they represent the 'typical' borrower.
These examples underline the value of the standard deviation in real-world financial and banking situations. By quantifying risk and variability, it allows finance professionals and banks to make better-informed decisions.
Let us understand how standard deviation works with an example.
Suppose you want to calculate the standard deviation of Fund A between January and April 2024. Assuming the returns are as follows:
| Month (2024) | Returns (%) |
| January | 14 |
| February | -8 |
| March | 9 |
| April | 6 |
Now, the average return for this period is (0.14 + (-8) + 9 + 6) / 4 = 0.165 or 16.5%.
Now, we can calculate the standard deviation using the formula:
√(0.14 - 0.165)² + (-0.08 - 0.165)²+ (0.09 - 0.165)²+ (0.06 - 0.165)² = 0.0241 or 2.41%.
Standard deviation measures how much the returns of a mutual fund are deviating from its average returns. Variance is the average of the squared differences between the fund's returns.
There's no right answer to what is a good standard deviation. A lower deviation is better if you are a conservative investor and seek less volatility and risk. On the other hand, a high standard deviation may be acceptable for investors seeking higher returns despite the increased risk.
Mean deviation helps determine how much returns deviate from the average but it doesn't consider the direction of deviations. Whereas, standard deviation measures the square root of the average of the squared differences considering the direction of deviations.
A low standard deviation indicates the fund’s returns are closer to the average returns. On the other hand, a high standard deviation indicates the fund’s returns are widely spread out from the average, indicating higher volatility and risk.


Click the “Allow” button to receive notifications
We're constantly crafting offers and deals for you. Get delivered straight to your device through website notifications.
All you have to do is click on “Allow”.

Now keep a track on your favourite fund

Go to the watchlist page to remove a fund from the list.


No funds are added to watchlist
Add your favourate funds to watchlist to keep them handy
No funds are added to portfolio
Add your favourate funds to portfolio to keep them handy

Trust the links that start from https://www.tatacapitalmoneyfy.com

Do not make payments
in any individual’s bank accounts.
Reach our Customer Care moneyfycare@tatacapital.com for assistance
For any assistance, contact our customer support
 Contact Us


 7 mins read